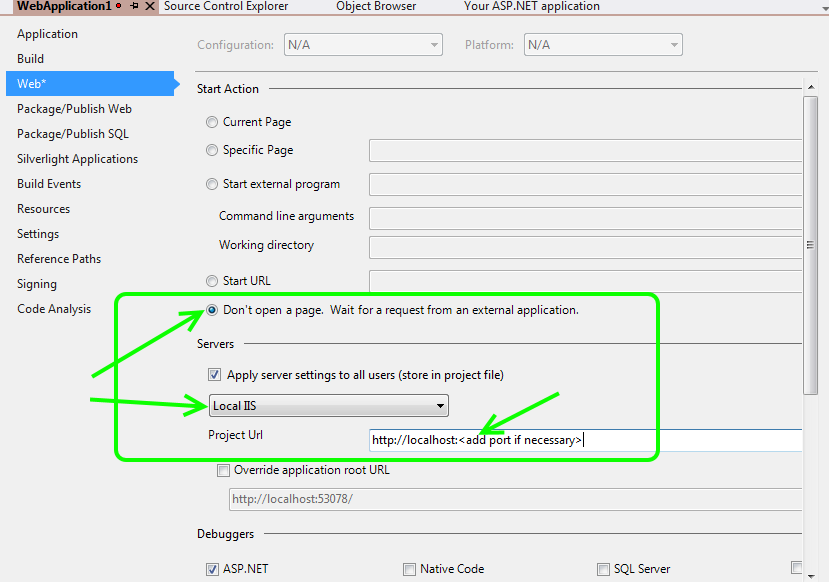
Default Visual Studio to Local IIS For Debugging

If you have a visual studio project setup in a way that you need to run from a local IIS rather then the IIS express that starts within Visual Studio then there are some quick ways to default your debugging to automatically point to the local.

  • On your project, right-click and go to “Properties”
  • Click on “Web”
  • (optional) Click on “Don’t open a page.”
  • Under servers, Select “Local IIS”
  • In the text box “Project Url”, make sure the correct url is entered for your website.
  • Save and you’re done.

Visual Studio Debug Local IIS

Enable NHibernate Logging to see the SQL Statements Executed

We had a need to see the SQL statements that NHibernate was producing.

You can put something like this in your app.config/web.config file :

in the configSections node:

1
<section name="log4net" type="log4net.Config.Log4NetConfigurationSectionHandler,log4net"/>

In the configuration node:

1
2
3
4
5
6
7
8
9
10
11
12
13
<log4net>
  <appender name="NHibernateFileLog" type="log4net.Appender.FileAppender">
    <file value="logs/nhibernate.txt" />
    <appendToFile value="false" />
    <layout type="log4net.Layout.PatternLayout">
      <conversionPattern value="%d{HH:mm:ss.fff} [%t] %-5p %c - %m%n"  />
    </layout>
  </appender>
  <logger name="NHibernate.SQL" additivity="false">
    <level value="DEBUG"/>
    <appender-ref ref="NHibernateFileLog"/>
  </logger>
</log4net>

In the assembly.cs file add:

1
[assembly: log4net.Config.XmlConfigurator(Watch=true)]

Help with Profiling and Memory Leaks in WPF C#

There are lots of great free tools out there to help you profile and find memory leaks in your C# WPF application.  My favorite for finding memory leaks has recently been CLR Profiler.  I also found the SlimTune to be helpful as well.  Enjoy the links!